Recently, I had the chance to sit down with a former colleague of mine that is now working full time as a Microsoft SQL database administrator and have a few certifications under his belt. The reason for the meet up was to help me dive deeper into some specific slow pages in our app. This blog is as much a documentation for myself as for others.
Looking for issues
First fire up the SQL Server Profiler from the “Tools” menu.

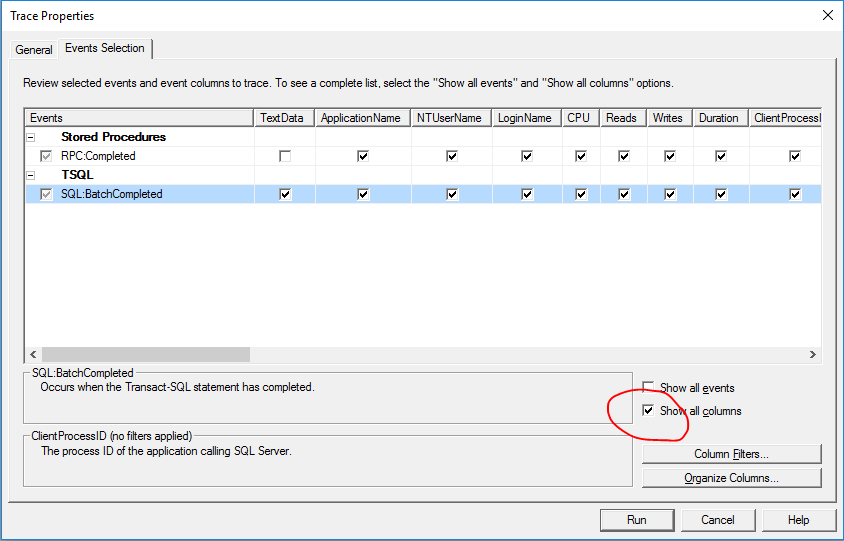
Connect the profiler to the database server and customize the included events as shown below. Only Stored Procedures and TSQL completed events should be necessary for this. Click the “Show all columns” checkbox and find the column with “Row counts” as this might be usefull in order to find the queries taking up time.
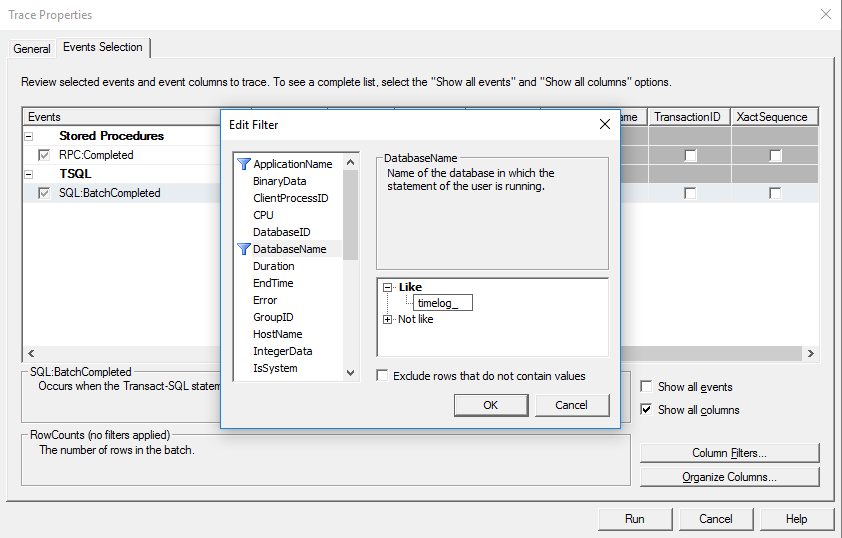
Click the “Column Filters…” button and add in the name of the specific database by selecting the “DatabaseName” as the filter.
Now the trick is to pause the trace. Clear the trace. Both from the toolbar menu. Navigate to the page you want to profile. To make it easier for yourself make sure no one else is using the database. Start the trace and perform the action(s) you want to profile. Pause the trace.
Two things to look for in the log.
- Number of rows (bottom right corner) – which is somewhat equal to the number of single requests to the database required for the action(s). Too many requests obviously slow down the performance. Look for duplicate requests (add single request cache). Look for patterns, like fetching a lot of single records instead of fetching them in bulk.
- Look for events with high numbers in “Reads”, “Duration” and/or “RowCounts”. Naturally, duration is the one hurting your performance but the two others might also pinpoint potential issues with high CPU and memory on the server.
Diving deeper
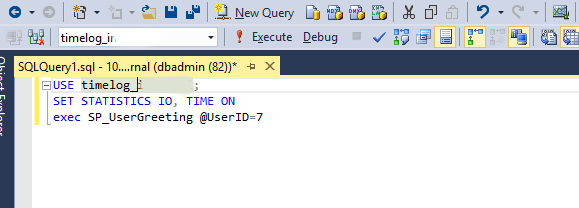
After identifying a request, you want to dive deeper into, copy the request including parameters and paste it into Microsoft SQL Server Management Studio. Add the extra line for the magic of getting request statistics and time. Also ensure you include the execution plan (CTRL+M or “Query > Include Actual Execution Plan…”) and client statistics (SHIFT+ALT+S or “Query > Include Client Statistics”).
Execute the command. Notice the new tabs in the results pane. The “Messages” tab now include timings and data statistics for the command. In particular, look for high “Scan count” and “Logical reads”. You may use statisticsparser.com to make it easier to read. The table associated with a high number should spark your interest. It could be due to a bad join, an inner select or missing indexes.
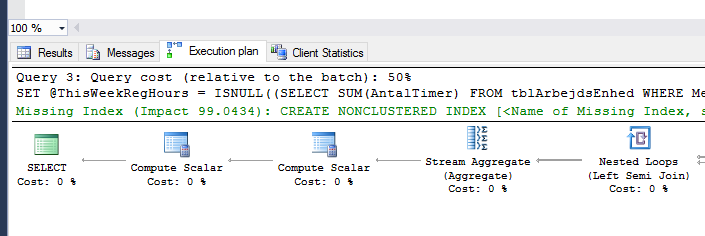
Additionally, look in the “Execution Plan” tab. Look through each of the inline parts and look for large graphs and in them look for the element with the highest cost percent. Also, you want to look for “Missing Index” notes. If it appears, right click that line and choose the “Missing Index Details…”. Examine the index and the fields it includes. Give it a name and try adding it, then profile again.
Just a few pointers about indexes. Only one clustered index per table and should only be used for integers – never ever guids. Non-clustered indexes can either have an INCLUDE part or not. If you do not specify which fields to include it will just be an index for quick searches, but after a successful find it will do a SELECT to get the fields it needs for the rest of the query. However, to eliminate that additional SELECT then the index needs the INCLUDE part and all fields required in the original query. If you have a SELECT * FROM then you need all the fields in the include as well. It also means that is expensive in terms of hard drive space keeping the index and processor power needed to update the index upon inserting new records. So it is necessary to consider both options. Also, before adding indexes everywhere after a few iterations of performance optimizing do consider that some of them might overlap so they are not all necessary.
That is the essence of my takeaways. Are there more I should have added?
